

See upcoming and forecast dividends
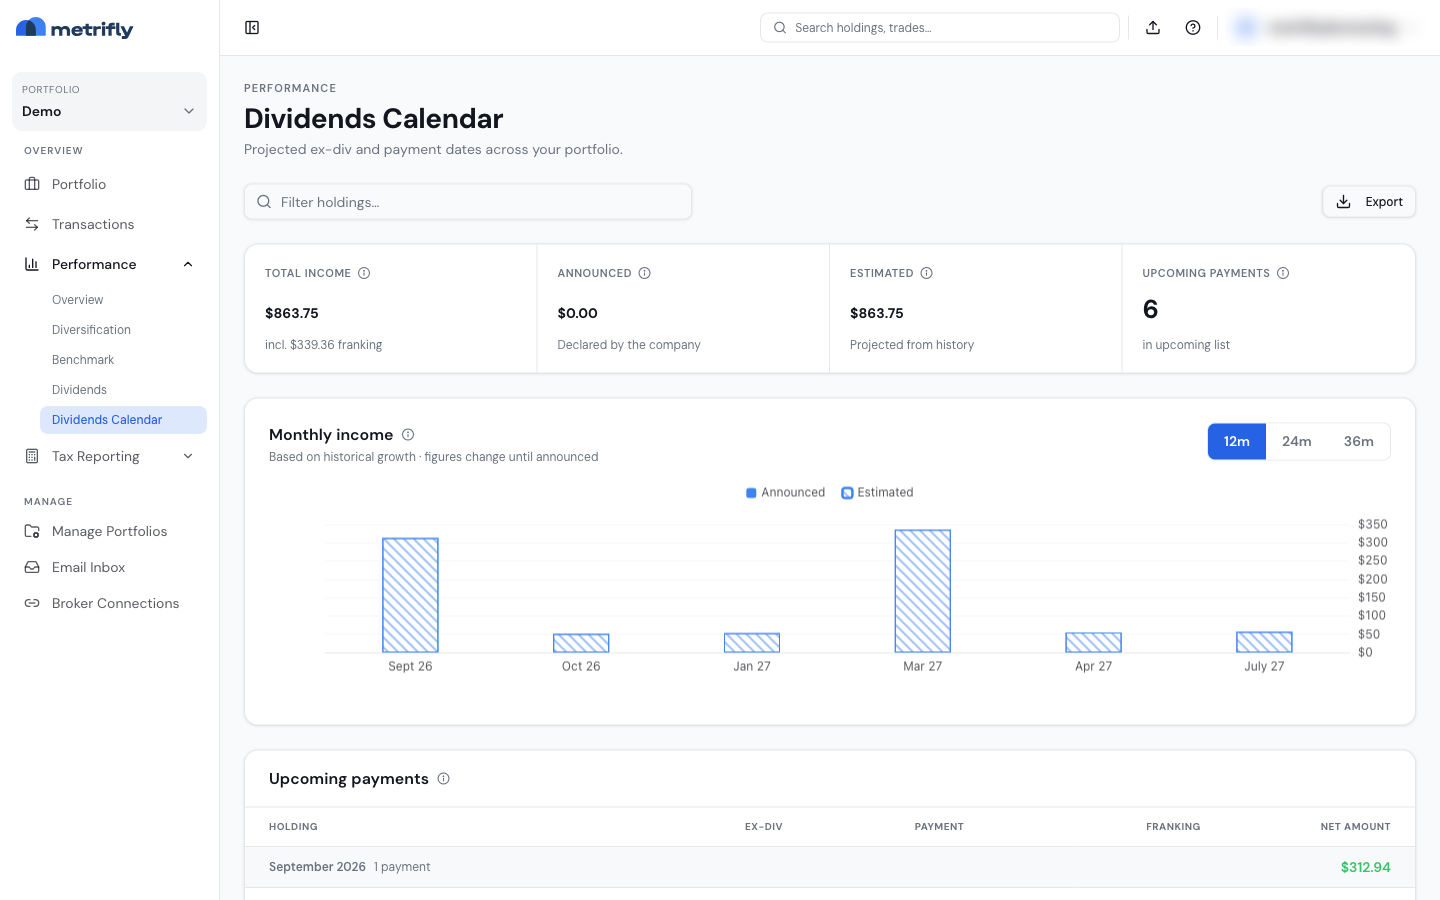
The Dividends Calendar projects your cash and declared dividends forward from your current holdings, so you can see what income is coming. By the end of this, you’ll know how to read the forecast and what’s behind the numbers.
Open the calendar
Section titled “Open the calendar”Go to Performance → Dividends Calendar. Toggle the horizon — 12m, 24m, or 36m — on the Monthly income chart to set how far ahead the projection runs.
What the page shows
Section titled “What the page shows”| Section | What it shows |
|---|---|
| Summary stats | Totals for the horizon, split into declared and estimated income |
| Monthly income | A bar chart — solid bars are declared, hatched bars are modelled |
| Upcoming payments | A table grouped by payment month (ticker, amount, ex-date, status) |
Use Filter holdings… to narrow the table to specific tickers.
Event statuses
Section titled “Event statuses”| Status | What it means |
|---|---|
| Paid | Already received |
| Announced | Declared by the issuer, not yet paid |
| Estimated | Projected from history — not guaranteed |
Projections assume your current share counts (no future buys or sells), apply historical growth capped at 15% a year, and carry franking from the latest payment where relevant. Securities without recent payments may be left out.
Export
Section titled “Export”Export downloads an Excel file for the selected horizon (single portfolio only).
Troubleshooting
Section titled “Troubleshooting”| Problem | Fix |
|---|---|
| You see an upgrade card | This is a paid feature. See Compare plans and pricing. |
| It’s empty in group mode | Select a single portfolio. |
| The forecast looks low | New holdings don’t have dividend history yet. |
| A ticker is missing | The security may have lapsed dividends or no detectable payment pattern. |